Wednesday, January 16, 2013

One in the hand ...

-------- Message original --------
Sujet: One in the hand ...
Date : Wed, 16 Jan 2013 09:44:45 +0100
De : Bernard Leclère
Pour :


The stock market is a wild beast. The beast is out of its cage in the USA.
The Leclere® USA index is pointing to 12.18% overshoot above its top trading band. As a comparison, the overshoot was 18% in 2007 and 11% in 2011:


The situation is putting an end to the buy recommendation (for a small potential upside in Euro terms) made on 13 Sep 2012.
The beast is in the bush.
 

Thursday, September 13, 2012

Buy signal but small upside

------- Message original --------
Sujet: Re: ...
Date : Thu, 13 Sep 2012 18:12:53 +0200
De : Bernard Leclere
Pour : M...

Bonjour M...,

What's new?
j'avais noté ton dernier signal d'achat.
J'ai commencé à faire de l'analyse technique à partir de mon indice. J'ai trouvé un premier système de trading qui semble prometteur (analyse à partir de mon indice pour trouver des signaux d'achat sur le S&P500 étant donné que mon indice n'est pas "tradable").
Ton dernier signal correspond au dernier signal d'achat (flèche verte) dans la fenêtre 'Alpha' ci-dessous. Ton timing (de +/- 6 mois si je me rappelle) correspond à mon analyse de cycles sur lequel je ne vais pas m'étendre ici.
En résumé, tes dernières analyses fondamentales "kloppent" avec mon analyse technique.

But.

Ce qui m'inquiète, c'est que ce signal se trouve au-dessus de la fourchette autour du GDP, proche de la zone des bulles (fenêtre "GDP target" ci-dessous), ce qui laisse présager un faible potentiel de hausse à ce niveau (hausse qui pourrait du reste être mangée par une baisse du dollar pour un investissement aux USA).

...Bernard

Thursday, May 31, 2012

Deflating, as foreseen


See message of 18th January.

Copyright © 2012 . All rights reserved

Wednesday, January 18, 2012

There we go again

In a message dated April 10, 2008 (“Gold/US$/Commodities” Cycle), I explained the cycle in the price of gold, the US $ and commodities. In another message (March 22, 2008: Rates and commodities), I warned of the danger of a diverging trend between commodities prices and interest rates. In today's FT’s article "Central banks increase gold lending", one can read that banks are borrowing gold (ndlr: in the hope the price will fall) and swapping it against dollars (ndlr: which they expect to rise). The cycle “Gold/US$/Commodities” is still operational. Furthermore, a clear peak in commodities prices (a sign of inflationary pressure) in 2011 is again lagging the falling trend in interest rates:As in 2008, this is not good news for the stock market.

Copyright © 2012 . All rights reserved

Wednesday, January 4, 2012

ECB: the super fire-fighter

A lot of pressure coming from many sides is put on the European Central Bank (ECB) to print money and lend it to banks at a symbolic rate. These in turn could lend it to member states to help them finance their deficits at much more favourable rates than the current market rates. Germany stands by side with the ECB in resisting the pressure.

Here is a simple explanation of both pro and con positions.

The ECB is like a fire-fighter: it intervenes as lender of last resort, printing money for banks when they need it, in order, for example, to prevent a systemic risk. This fire-fighter moves in with a truck loaded with a water tank (money paper). The fire is so fierce (the crisis is so acute) that the tank is not large enough to put out the fire (there is not enough printed money). Those in favour of more printing by the ECB suggest to connect the water pipe to the city water distribution system to have a constant flow of water (let the money printing machine run as long as money is needed). Those camping on the side of the ECB, like Germany, reply:” if you do that, the owner of the house will be tempted not to insure his house at 100% of its value anymore because he will think that whenever there is a fire, the fire-fighter will be there within minutes with plenty of water”.

Both are right.

The solution is to connect the pipe to the city water distribution system, this time, and put out the fire. Then, take as many precautionary measures possible in order to limit damages of future fire breakouts.

The words “this time” are important. Especially in Europe. The USA, which is often quoted as the example to follow by those advocating an unlimited water flow, can afford to have their water pipe permanently connected to the city water distribution system because the US dollar is used worldwide, between other things, to price many basic materials: the excess water flaws abroad (the USA is exporting its inflation with the consequence that the price of bread eaten abroad goes up and is feeding up revolts, mainly abroad).

In Europe, the situation is different. Most of the excess water stays in Europe.

So, before printing an “unlimited amount of money”, it is even as vital for Europe to think, now, on precautionary measures to make sure that member states will, not only on paper but in the facts, rein in their budget deficits.

Tuesday, January 3, 2012

Outil pour résoudre la crise: plus de leasing

Comme l'a rappelé un rapport de l'OCDE, un catalyste majeur de la crise fut la crise US du "subprime-cum-securitisation" et la résolution du problème risque de prendre du temps.
Tout le monde l'a compris aujourd'hui, il y a un problème au niveau de la titrisation de leurs prêts par les banques.
Ce problème est, selon moi, structurel et est lié au métier de la banque.
Le métier de la banque est de récolter de l'épargne et de la faire travailler en l'investissant dans des outils "productifs".
Les outils "productifs" connaissent deux profondes mutations. Il y a, d'une part, la délocalisation d'industries vers des pays émergents lointains, ce qui complique le contrôle, et, d'autre part, la spécialisation croissante de métiers qui deviennent de plus en plus pointus et compliqués à comprendre pour les banquiers. Devant ces changements, les banquiers ont tendance à se tourner d'avantage vers des produits faciles, tels les emprunts d'état, qui ne sont pas nécessairement "productifs", et, d'autres part, vers des produits faciles à titriser afin de faire reporter sur les épargnants eux-mêmes les risques dans des investissements qu'ils maîtrisent de moins en moins.
Les banques, toutes utiles qu'elles soient, ne sont pas elle-mêmes l'outil "productif" qu'elles prétendent être: la valeur ajoutée du secteur bancaire, c'est-à-dire leur contribution dans le PIB, est souvent inférieure à la part qu'elles occupent en bourse. Cela signifie qu'elles détournent vers elles-mêmes une partie de l'épargne supposée aller vers l'appareil de production. Entre parenthèses, ce n'est pas en faisant (ou voulant faire) le métier des autres (assurances, pensions, ... notaires ...), qui du reste font bien leur métier, qu'elles participeront d'avantage à la croissance du PIB.
Le métier de banquier de demain devrait aller dans le sens de la simplification: (re)devenir celui de simple collecteur d'épargne et de distributeur de produits financiers développés non, comme dans le passé, par elles mais par d'autres.
Parmi ces derniers pourraient figurer d'avantage les sociétés de leasing.
Les sociétés de leasing sont en général spécialisées dans un domaine qu'elles connaissent bien: voitures, immobilier, outils de production ...
Moins bien représentées en bourse que les banques, elles occupent pourtant une place plus importante dans le PIB que le secteur financier. Plutôt que de titriser des emprunts accordés par des banques, pourquoi ne pas favoriser d'avantage le leasing coté en bourse? L'épargne pourrait ainsi être directement récoltée via la bourse, avec les conseils éventuels des banques qui toucheraient ainsi une commission de distribution et/ou de conseil. Bien que n'offrant aucune garantie de sécurité absolue, une société cotée en bourse fait l'objet de plus de contrôles qu'une société non cotée. De plus, les banques pourraient continuer à faire leur métier de base, c'est-à-dire accorder des prêts aux sociétés de leasing, à condition, évidemment, que ces derniers (les prêts) ne soient pas à leur tour repackaged en bourse... mais qu'ils soient négociés via le marché obligataire: un repackaging en bourse ne serait rien d'autre qu'un "ponzi scheme" au niveau du capital.

Copyright © 2012 . All rights reserved

Saturday, October 8, 2011

Letter to Angela Merkel

-------- Message original --------
Sujet: Like a tightrope walker
Date : Tue, 04 Oct 2011 16:46:45 +0200
De : Bernard Leclere
Pour : Angela Merkel


Dear Mrs. Chancellor,

The press echoed a speech you made in Berlin on September 20th, speech in which you are quoted as saying “A wrong philosophy of economic growth at all costs has spurred countries to take on debt and must end if policy makers want to leave the crisis behind “ (Bloomberg Sep 20, 2011).

I am writing to you because of your background in physics.

The word “philosophy” tells it all.
While one would expect economists to search for an increasing reliability on objective economic measures, the world is whirling in a vicious circle of what seems to be an infinite number of expectations. At the center of the circle, there is the subjectivity of the value of money (and of debt), subjectivity leading to a "leveraged" subjectivity of the value of assets ...

Some basic principles in economy are derived from Thermodynamic laws.
These laws indicate that a high level of debt is not the only culprit of excesses. Other excesses, like in equity prices, can have even damaging effects on growth, especially when the equity part of assets tends to contain an increasing number of assets of all kind, including real estate, gold, ... quoted on the stock market.
Contradicting valuations in equity prices are of course not, per se, a bad thing: they actually contribute to the fluidity of markets. Problems can however arise when valuations are either too high or too low. But, when is "too high" and "too low"? The fact and the matter is that nobody knows it for sure.
Nobody knows it because, according to us, there is something missing in the basic rules.

For equity prices valuations, agents are following rules which are taught in all schools.
The background of economists comes from classical physics:
- In a balance sheet, assets must always equal liabilities.
- At a national level, whatever the way one uses to calculate the GDP, be it the revenues or expenditure or production approach, the result must always be the same.
- …
The background of the corporate financial world comes from quantum physics:
- Risk theory based on statistics: risk linked to the volatility of (sometimes) arbitrary measures.
- …

We think that what is missing is to be found in a phenomenon observed in physics.

Economic and financial models can be compared to a tightrope walker:
- Pole = (macro)economy … (gravity/classical physics)
- Individual = financial models …(nuclear force/quantum physics)
- Rope = Black-Scholes formula …(electromagnetism)

What is missing?

The movement.
The movement is presently left to the workings of the … Invisible Hand of Adam Smith!
In the universe, the equilibrium movement of the tightrope walker has a name: the KMS (Kubo Martin Schwinger) state. The KMS concept is, according to us, a better metaphoric reference than the "Invisible Hand" because it can lead to the search of a concrete measurement tool.

A tightrope walker doesn’t look at his feet but at the point he is aiming at.
Stock markets do not have such a point in view. In theory, a stock market should follow the economy. In practice, by gauging its volatility, it doesn’t. It is even commonly recognized that it is not possible to compare any stock market measure to a central measure of the economy.
With this in mind, we have decided to design a new stock market metric with the hope to be able to compare it with a central measure of the economy, the nominal GDP.
We came up with a first index for the USA market: USA GDP Target Index.
The index is a "nominal GDP weighted" index in which constituents, i.e. domestic companies, are weighted according to their relative weight in the US nominal GDP. The approach gives an "economic touch" to the stock market metric which is not found in other indexes.
The results of the calculation of the USA GDP Target Index look as follows:


On the above graph, the reading of the index was made in conjunction with the nominal GDP, the Dow Jones Ind., the S&P500 composite and a statistical measure (i.e. one standard deviation) applied to the after-tax profits data of the corporate sector(1) .
To compare it with the previous image of the tightrope walker:
- The nominal GDP = the rope
- The GDP Target Index = the individual
- The envelope = pole
- The reverting effect of the GDP Target Index to the nominal GDP = KMS condition.

Equilibrium points seem to emerge on this graph (GDP Target Index close to the nominal GDP data) as well as what could be called "speculative" periods (GDP Target Index falling outside the envelope around the GDP). By opposition to other traditional indexes, the GDP Target Index pointed to over-valuations in 2006/2007 and 2010/2011.
Furthermore, according to us, a high level of symmetric divergence between the stock market and the GDP could be associated with a high level of stress in terms of financial instability, as defined by F. Mishkin and E. White(2) , while not stressing crashes seem to cluster round a symmetric divergence close to 0 (3).
If this assumption is correct, the GDP Target Index could give a good indication of investors excessive expectations and be used as a gauge for forthcoming situations of potentially high financial stress. The information it provides could then, if properly distributed, act as a simple and not expensive pressure regulating valve for the market, thereby hopefully reducing somewhat the dramatic loss of jobs often seen in periods of high financial instability.


We hope that you will find this information useful.
If it is the case, we would be glad to provide you additional information you may wish to require.
Looking forward to hearing from you.

Yours faithfully.

Bernard Leclère

(1) Profits data take into account profits made at home and abroad.

(2) Mishkin, F., White, E. What Should the Fed Do About Stock Market Crashes: A Historical Perspective.
(3) The equilibrium year which served as reference for the index divisor is the year 2000. This was based on the study of: McGrattan, E.R., Prescott, E.C., 2000. Is the Stock Market Overvalued ?. Quarterly Review Vol. 24 No. 4. Federal Reserve Bank of Minneapolis.
Copyright © 2011 . All rights reserved

Monday, September 12, 2011

Stop Losses

Copy of email sent on Aug. 24th

-------- Message original --------
Sujet: Stop losses
Date : Wed, 24 Aug 2011 16:37:19 +0200
De : Bernard Leclere
Pour :

Hi all,

Based on a Dow Jones Ind. analysis, I assimilate the current stockmarket pattern to the one prevailing in the period 1932 - 1942. My understanding is that the market is closing in to the end of this pattern (2002 - 2012). I do not know when the final "capitulation" will be: it could be between now and the first quarter of 2012:

(click on image)

A stop-loss (based on the standard error channel) was triggered on the Dow Jones Ind. on the 22d of August, stop-loss which is still there today despite yesterday's good performance of the market.


For the record, I mention that a (last) support line for the GDP Target Index was (slightly) broken at the close of August 22, making the index reach a lower low:


(click on image)

Just a thought.

Bernard
Warning: The information provided does not constitute an offer to buy or sell any securities and should not be the basis for an investment decision.


Thursday, September 1, 2011

Message restaured

Friday, August 12, 2011

Did I short the market?

Somebody recently asked me the question: are you short?
The answer is: no.
Why?
Tails in the market cycles length can last one year. It is practically impossible to forecast short term rebounds, how long they will last and how big they will be. Forecasting the amplitude of long term trends is already difficult enough. I stick to that.

Friday, August 5, 2011

Bourse: la patate chaude soldée à - 40%

-------- Message original --------
Sujet: Bourse: la patate chaude soldée à - 40%
Date : Wed, 03 Aug 2011 13:24:01 +0200
De : Bernard Leclere
Pour :

La patate chaude de la crise de 2008 est en train d'être redistribuée, lentement mais sûrement, à la population. Les autorités n'ont pas eu le choix: l'alternative était la faillite de tout le système financier, et, par voie de conséquence, de tous.
La crise ne sera définitivement réglée que lorsque toutes les factures seront payées: cela risque de prendre des (dizaines ?) années.
Un second choc boursier, telle la seconde vague d'un tsunami, est en train de se produire. Suite à l'effet de dilution mis en place par les grands argentiers, cette seconde vague sera moins forte que la première (2008/2009). J'estime sa densité égale à 2/3 de la première: soit une chute du plus haut de cette année de -40%. Reste donc encore, à ce jour, une baisse de -30% à subir
(click on image):

Maigre consolation, en regard des millions d'emplois dans le monde qui vont disparaître, une baisse totale de -40% ramènera l'indice à un niveau d'évaluation non spéculatif, dans une zone proche de 13500, soit +/- 10% en dessous de son équilibre qui se situe à +/- 15000.
La chute sera donc moins forte qu'en 2009. La reprise risque aussi d'être plus lente ...

Just (more than) a thought.

Bernard Leclère
Warning: The information provided does not constitute an offer to buy or sell any securities and should not be the basis for an investment decision.

Thursday, June 9, 2011

Weighting method of custom index

The first draft of my proposal to calculate a stockmarket index in which constituents are weighted according to their weight in the economy was sent in 2006 to a number of influent organisations: central banks, IMF, World Economic Forum ...
In this draft, a simple methodoly was proposed i.e. a revenues weighted method.
By coïncidence (?) ... a US company launched an ETF following this methodology a few months later...
The theoretical method which was then advocated proves to do, in practice, a poor job in meeting the original objective. For this reason, it is applied by this US company to the existing S&P500 index and its comparison with the nominal GDP gives, as no surprise, no additional information.

Today, I have entirely reshaped the methodology and the weighting method is far more complex than the one originally advocated. Because it deals with macro data, it is not patentable. Its plain disclosure could motivate some people to copy it ...
I have set a theoretical background for this research in 2006. The calculation of the index took over one year of work ...
If you are interested in this subject, I hope you will understand that I will be far more cautious than in the past when providing information about the present methodology.

Le bouchon va finir par sauter ...

------- Message original --------
Sujet: Indice US (new name: LECLERE® index)
Date : Fri, 13 May 2011 08:12:30 +0200
De : Bernard Leclere
Pour :


Bonjour ,

....
La bouilloire commence à fumer pour le marché US. Voir "GDP Target Index" sur le graphique ci-dessous (les indices ont été mis à la même échelle):

Si les lois de la thermodynamique fonctionnent toujours, le bouchon va finir par sauter ...

Tuesday, June 1, 2010

Normal correction

Subject : Normal correction

From :
Bernard Leclere
Date :
Fri, 21 May 2010 07:39:51 +0200
For :


Hi all,

As shown in the chart hereunder, the present market correction is ... normal. The market is simply moving back to its equilibrium (click on image):


The custom US stock market index (green line named "GDP Target Index" on the chart) is reverting to the GDP level (red dots at the center) after having touched the top of a range set around the GDP by taking the distribution of the percentage of net corporate profit/GDP (the range is the standard deviation of this distribution).


Tuesday, November 10, 2009

USA: is all in the cycles?

Despite a high P/E for the s&p 500 and s&p BMI US indexes and despite many technical negative divergences, the stock market keeps moving upwards.

All being equal, the stock market could continue to do so for a couple of years thanks to the configuration of cycles.

We are in the first phase of a new Kondratieff cycle which began in 1998. If this very long term cycle is sliced into, first, decennial patterns and then Kitchin cycles, we can see in the chart below that we are presently in the first Kitchin cycle within a decennial pattern which began in 2009.
Yes, there is a risk of a major down leg (as in 1942 and 1978 - see the DMI indicator in the chart) but probably not before the present Kitchin cycle has completed its course, i.e. between 2011 and 2012.

I suspect the Dow Jones Industrials to move upwards and reach its equilibrium point as set by the present level of GDP, i.e. 14300, within 2 years. But the path could be bumpy because of the dollar (probably down), commodities prices (probably up) and interest rates (probably up).This suggests a possible decoupling between stocks and bonds within the next two years. If it is the case, it would be the source of the future down leg for the stock market in 2011/2012 ...


Thursday, October 16, 2008

GDP Target Index : a new macroeconomic tool.

Reference to KMS state and "Invisible Hand": click here

Thursday, October 2, 2008

L'économie est sphérique

L'économie et la finance sont un gigantesque puzzle dont chaque pièce est en interaction plus ou moins directe avec d'autres pièces. Cela entraîne souvent des discussions d'auberge espagnole entre économistes, car lorsque l'un d'entre eux parle d'une pièce du puzzle, un autre va parler d'une autre pièce. L'exemple de la discussion autour du plan de sauvetage de Paulson aux USA offre un exemple de plus des divisions au sein de la communauté des économistes.

Ce que certains semblent ignorer, c'est que le puzzle n'est pas plat mais sphérique.

En soulevant une pièce du puzzle, on se rend compte que le centre de toutes les pièces est le même. Pour éviter certaines discussions stériles, il suffirait que tous les économistes acceptent de gratter en dessous de chaque pièce.

Que trouve-t-on en grattant?
Dans une première sous-couche, on peut voir que l'économie est un produit dérivé de sciences fondamentales, comme la physique, et que l'on retrouve en physique le même grand schisme que l'on retrouve à la surface, c'est à dire en économie: schisme entre déterminisme (physique classique: gravité etc.) et physique quantique (théorie du chaos, des jeux etc.) qui se traduit, en économie, par schisme entre Keynésiens et classiques.
Sous cette couche, toujours en faisant référence à la physique, on trouve la condition KMS (Kubo-Martin-Schwinger) que j'associe à la main invisible d'Adam Smith. C'est dans cette couche que l'indice GDP Target Index prend ses racines: The KMS state, the stock market and the economy .

Copyright © 2008 . All rights reserved

Tuesday, July 29, 2008

the US dollar's real face

When writing or speaking about the dollar, currency strategists tend to ignore a key parameter intervening in the fixation of the exchange rate: money supply. When the USA sent planes full of dollars to pay Afghan civil servants or when the Fed opens its window to let dollars flow into the market, it does more to the dollar and, by extension, to global inflation, than interest rates.
The stance of US officials, when they speak about the strategic interest for the US of a strong dollar, leaves me skeptical. The USA economy is a debt driven economy and it is of their strategic interest to repay their debt with a weak currency. No wonder that, to quote Richard Fisher, a Fed's member: "We Americans do love debt ! "...
To make the world swallow the pill easily, the USA have to do some window dressing for the money supply and debt figures. The USA has made it difficult to know the real money supply total (M3 is not published any more). The latest M3 chart available shows that the supply shot up in 2002 when growth was slowing down... The discussion between Ron Paul and Alan Greenspan about M3 in the senate speaks by itself. On the debt side, Daniel Gros of the Center for European Policy Studies, showed that there was a hole of $1.8 trillion in the debt reporting at the end of 2004.
Sure the USA will not default on its debt because they can continue to monetize it (print dollars to repay it) as long as it stays a leading reserve currency. But for how long?
Addendum 3/04/09.
Today, because of the crisis and in order not to add additional pressure on the world financial system, the USA have managed to keep the currency in a stable range. They are doing so through monitoring the price of gold... How is that? The $ has a negative correlation with the price of gold as evidenced by the following chart:

Knowing this, the USA are leasing their gold reserves to companies playing on the gold market in a way which pleases the US authorities: to push the dollar up/down, they push the gold price down/up (as previously written, major moves of the dollar are preceded by moves of the gold price).

Things have therefore steadied lately on the dollar and gold front. That will change in a few years time when the USA will feel more independent in terms of energy (construction of new nuclear power plants etc.) . Today, because of the inverse correlation between the dollar and commodities prices, when the dollar goes down, the USA feel the pinch in terms of inflation. Once less dependent for oil, the USA will devalue the dollar to repay its pile of debts... When you will see the long term trend of gold going up again, get ready for a nice slide downhill for the dollar.

(Addendum 5 August 2011:
When the stockmarket goes down, so does gold. If, as expected, the market moves into bearish territory for the rest of the year, the dollar will consequently go in the opposite direction. The recent drop in the dollar is a buying opportunity: piling up some cash of it with the objective of stepping back into the US stockmarket later in the year ...).

copyright © 2008. All rights reserved.

Thursday, May 29, 2008

The "prices desticking " property of the weak dollar during shocks

Mishkin's resignation as a Fed Governor was the occasion for the Wall Street Journal to comment his recent views on major topics like the US $ ("nominal exchange rate have exerted small effects on consumer prices" - ref. WSJ).
With all the respect I have for F. Mishkin, I do not share his opinion on the effect of the depreciation of the dollar on inflation.
It is true that in a closed economic system, like the one prevailing before the fall of the Berlin wall and/or in the absence of a supply or demand shock, the (slow) depreciation of the US $ has served the economy of industrialized countries by generating a mild inflation. However, shocks ( oil supply shocks of the 70's or global demand shock of the last 10 years) multiply the effect of the depreciation of the US $ on global inflation.
For an easy illustration of my view, I will use the US $/CHF rate and the Dow Jones commodity index (as a proxy variable for inflation).

Click on chart or a better view.
I read this chart as following:
- in the seventies (oil supply shocks), the dollar value was divided by 2.8 + high commodities prices (and inflation).
- in the 80's and 90's (closed system), $ and commodities were both on a bumpy road ("desynchronised" correlation between the two).
- since 2000 (global demand shock), the $ has lost over 70% of its value + high commodities prices. Emerging countries can fully exploit the structural changes they made since the fall of the Berlin wall. The weakness of the US $ adds up to the extra demand they generate for pushing up commodities prices even higher.

The world does not need a weak US $ for generating a mild inflation right now. The new demands from emerging countries is more than enough for doing the job. Like in the seventies, the weak dollar has a poisonous "prices desticking" property.

Monday, May 26, 2008

Technical long term sell signal in a bullish scenario

I apply different buy/sell methods depending on the long term market trend: bullish, bearish or consolidation.
I have been bullish since the last quarter of 2004. The market timing method I use in a bullish scenario has rendered a sell signal on the Dow Jones Ind. on May 6th. This signal has been confirmed on the Dow Jones Transport at the end of last week.
From a fundamental point of view, I explain the signal by the negative effect of a weak dollar on inflation and real growth. Given the high correlation between Wall Street and the world's stock markets, the message is a broad sell.
So still bullish, but in a profit taking mood ... even if I do not expect a major fall at this stage because, even though the Dow Jones Ind. has a high p/e of 85, it is close to the GNP valuation level.
Gold: after the April 8th sell signal, gold is offering a second chance for profit taking. From a fundamental point of view, this may sound contradictory in view of the falling dollar. However, as already shown previously, tops of gold tend to precede bottoms of the US $.

Tuesday, April 22, 2008

On George Soros

Interesting conference by G. Soros at the CEPS (Center for European Policy Studies) on April 18th where he presented his latest book (The New Paradigm for Financial Markets: The Credit Crash of 2008 and What It Means).

G. Soros suggests that the cause of bubbles often lies in wrong academic approaches as to the relevance of "reality" and "perception of reality" factors in social and economic matters.
As a practical man, he recommends more regulations and that a more active role be played by financial authorities. I agree with that.
However, his proposals do not answer the more fundamental questions which he raised.

The duality "reality/perception of reality" could be viewed within the framework of the emergent behavior theory which can provide a meaningful concept for
describing a fundamental issue at the core of the formation of bubbles: stock market bubbles do form because of the lack of an emergence property in the price settlement process.

copyright © 2008. All rights reserved.


Thursday, April 10, 2008

"Gold/US $/Commodities" Cycle

There seems to be a sequence between long term trend reversals in gold, the US $ and commodities.

1/ Tops/bottoms of gold tend to precede tops/bottoms of US $/CHF:

2/ I have already shown that bottoms of US $ v. CHF (or tops of CHF) tend to precede tops of commodities (see here).

On April 8th, I posted a sell signal on the gold/silver index.
I see no technical buy signal for the US $ on my screen and do not expect such a signal before the Fed starts being more orthodox concerning the $ ... Historical data show that many months can elapse between both sell signals on gold and on the CHF.

copyright © 2008. All rights reserved.

Tuesday, April 8, 2008

Technical sell signal on the gold/silver index

The following chart is self explanatory:


copyright © 2008. All rights reserved.

Monday, April 7, 2008

There is no correlation between the US $ and US interest rates

Some currency strategists attribute the weakness of the US $ to the low interest rates in the USA. This supposes that there is a correlation between the two. Data dating back to the seventies contradict this assumption.

Periods when there was a correlation(no correlation) are marked by a blue(red) trendline.
Out of a total of 441 months, 69% are in red.
There may well be a correlation since May 2005, but no conclusion can be drawn from this period in regards of more comprehensive historical data.

All this to say that the current weakness of the US dollar has more to do with the money supply.

copyright © 2008. All rights reserved.

Friday, March 28, 2008

Commodities: the end of the bubble? Part 2

Commodities got a nasty hit lately: was it the sign of a top or of a "normal" correction?
The chart below shows that, in the past, tops of commodities were preceded by tops in precious metals.

While there may be signs of a slowing down in the uptrend of gold, there is no evidence yet of a downturn in precious metals. Therefore, the recent downturn in commodities looks to me more like a correction than a trend reversal. Should the trend in gold reverse, then one might expect the same in commodities some weeks or months later.

copyright © 2008 All rights reserved

Thursday, March 20, 2008

Rates and commodities

Since the 80's, peaks in commodities prices tend to coincide with or lag peaks in interest rates (ex. 5 year t note).
They lagged on three occasions: in 84, 01 and 08:


Yet another sign of a continuing downturn for stocks in 2008?

copyright © 2008 All rights reserved

Monday, March 17, 2008

The dollar crisis

In April 2007, I wrote an article on "The end of the American empire" and related the fall of the USA to the fall of the dollar.
There we are today.
Things are going much faster than I thought.
As far as Europe is concerned, the solution is not in relaxing interest rates, as many people suggest, and I hope Jean Claude Trichet will resist the pressure.
Central banks need to restore the confidence in the dollar, urgently.
This crisis will speed efforts to price oil, metals and other soft commodities in another currency than the dollar.

copyright © 2008 All rights reserved

Thursday, March 13, 2008

Fair value

There have been a lot of talks recently about the "fair value" concept (which is as old as the first coin).
In 2006, I wrote a paper on stock market indexes entitled: The Profitip Index (registered name: Leclere® index). To summarize it, the idea is to try to anchor a national stock market index to the nominal GDP growth rate of a country: a sort of "nominal GDP targeting" stock market index.
From the onset, I realized that the major problem with the proposal made in the paper was to find the right equilibrium price to be used as the starting base/reference for the index.
The actuality made me take the paper from the shelve, have a fresh look at it and try to come up with a new proposal.

Proposition:

At the equilibrium:
1/ 1 $ invested in the stock market (i.e. in the capital of a company) delivers a return ( "% (earnings minus dividend)/$ share") (A) equal to the nominal GDP growth rate.
2/ Nominal GDP growth rate = average interest rate, which is then said to be the "equilibrium interest rate" (B).
3/ Equity risk premium = dividend yield.
4/ Fair value = (B) - (A) = 0
Interpretation: the fair value is the relative value of stocks compared to bonds. If the fair value is above(below) zero and the dividend yield is not taken into account, bonds have a better(worse) return than stocks.
5/ Potential relative return of stocks v. bonds = fair value + dividend yield

The proposition is made at the macro level and is not meant to be used on an individual company level.
It can be applied to compare different countries.

Example: (end-of-February 2008 - data sources: The Economist and Standard&Poor's)


(Click on image for a better view)

(*) tentative equilibrium: the equilibrium is thought to be targeted when the average lending rate is close to the nominal GDP growth rate (difference < +/- 1%).

One should also add other criteria like: earnings/$ share, growth rate, inflation, budget balance, current account balance, average lending rate, price to cash flow, price to sales, to name but a few.

Important notice: these data have to be regularly updated. They are provided as an illustration of a method and are not recommendations to buy or sell any equity. Market timing is important in investing.

Copyright © 2008 . All rights reserved.

Friday, February 29, 2008

Commodities: the end of the bubble?

It would be a good exercise to run an Engel's test on the commodities futures and dollar time series. As, at this time of writing, I am not equipped for that, I have tried to make a quick extrapolation from the chart.


The correlation between the 2 series seems to have improved since the end of the nineties and reflects the slow but sure loss of the leading role of the dollar as a reserve currency. The result of this is that any move of the dollar is today immediately reflected in commodities prices.
This has a major impact on the efficacy of interest rates cuts in the USA: growth will be slowed by higher commodities prices.
The USA are cornered.
Unless central banks decide to intervene on the dollar front....
Until then, get ready for a nice Russian mountain ride on the equities market.

copyright © 2008 All rights reserved

Thursday, January 24, 2008

The Fed does have some margin... (?)

According to the technical analysis theory, at the end of bull trends, stocks fall down on their own weight, i.e. falls do not need to be accompanied by big volumes. Recent falls were made, on the contrary, on huge (historically high) volumes: foreigners seem to prefer to buy US assets than to damp their dollars (for now).

The long term bullish trend can withstand a level of 10500 for the Dow Jones Ind. index (DJI):


The price/earnings ratio of the DJI is now close to 48 which is high.
A fall would break the neck to rising commodities prices and inflation.
If this scenario happens, the crisis will not be the"subprime mortgage" crisis, but the "dollar" crisis.

copyright © 2008 All rights reserved

Wednesday, January 9, 2008

Hedge funds demystified

Depending on the global index chosen, hedge funds composite indexes returned 10 to 12 % in 2007 (ex. Barclay hedge fund index: 10.42%; HFRI fund weighted composite index: 10.36%)
As a comparison:
- the total return (price + dividend yield) for the Dow Jones Wilshire Global Total Market Index was 11.9% ;
- the world nominal growth was 8 to 9.5 % that year (depending on the source: World Bank or IMF). If one adds the average dividend yield, this figure comes close to the hedge funds composite indexes returns.

copyright © 2008 All rights reserved

Wednesday, September 5, 2007

Le fonds de la crise des subprime mortgages (suite)

Selon John Taylor, rendu célèbre par la loi qui porte son nom (Taylor rule), la crise des subprime mortgages aux USA est due à la politique menée par la Fed à la suite du 11 septembre 2001: le taux a été abaissé à 1%, soit largement en dessous du niveau de l’inflation et de croissance de l’époque (ref : Reuters ).

Tout en illustrant l’impact négatif de la politique volontariste en matière de croissance de la Fed, la crise des subprime mortgages est aussi, selon moi, une illustration d’un problème plus fondamental exprimé antérieurement ( voir message du 24/08/2007).

Dans ma lettre ouverte à Nicolas Sarkozy ( « Pour un euro fort »), je défends le principe d’indépendance de la BCE vis-à-vis des pouvoirs politiques. La crise des subprime mortgages aux USA est un exemple de plus qui plaide en faveur de cette indépendance.

Friday, August 24, 2007

Le fonds de la crise des subprime mortgages

La crise des subprime mortgages aux USA est une parfaite illustration d'un problème que j'ai déjà évoqué dans ce blog. Tout comme la bulle de la fin des années 90 aux USA, elle est la conséquence de méthodes d'évaluation erronées en matière de risque: la cause est épistémologique.
Qu'est-ce que le risque?
Il y a deux grandes méthodes d'approche du risque: fondamentale et financière.
La méthode fondamentale consiste, en prenant l'exemple des prêts hypothécaires, à mesurer le risque de non remboursement en tenant compte de données sur: le salaire de la personne, ses dettes, ses obligations contractuelles etc.
En finance, le risque est principalement mesuré en termes de volatilité. Par rapport à quoi? Des moyennes. Des moyennes de quoi? D'ensembles statistiques.
Le problème est que ces ensembles ne peuvent être comparés aux ensembles utilisés par la méthode fondamentale. Il est donc impossible ( ou en tout cas très difficile) d'évaluer dans quelle proportion les mesures financières se rapprochent ou non des mesures fondamentales. On ne peut que subir, sous forme de crise a posteriori, tout écart.
Pour faire une comparaison: c'est un peu comme si la jauge d'essence d'une voiture n'était pas reliée au réservoir d'essence mais indiquait la quantité restante d'essence "probable" en tenant compte: du dernier plein, de la distance parcourue et de la consommation moyenne théorique par kilomètre.
Il en va de même pour la bourse. Les indices boursiers ( ensembles statistiques) ne peuvent être comparés aux indices mesurant la croissance économique ( ensemble fondamental).
La seule manière d'éviter ce genre de crise dans le futur est de calculer la volatilité (et donc le risque) par rapport à des ensembles reposant sur des données fondamentales. L'exubérance irrationnelle réside dans le manque de (bonnes) informations.

Lettre ouverte à Nicolas Sarkozy: pour un euro fort

Monsieur le Président,

Votre récente élection par le magazine Vanity Fair au top de la liste des hommes les mieux habillés au monde aura peut-être fait sourire certains eu égard aux nombreuses tâches, bien plus importantes, qui vous attendent en tant que Président de la république française.
Monsieur le Président, votre costume vous sied à merveille.
Il serait dommage de vouloir le troquer contre celui de Monsieur Jean-Claude Trichet de la banque centrale européenne (BCE).
Pourquoi ?
L'histoire nous donne parfois l'occasion de prendre du recul par rapport au présent. Dans une exposition d'art précolombien à Bruxelles, on peut admirer un manteau ayant appartenu à un chef de tribu indienne. Cette magnifique parure a la particularité d'être entièrement recouverte de plumes d'oiseaux rares. Les plumes servaient à l'époque de monnaie dans de nombreuses contrées. En recouvrant son manteau de plumes, ce chef pouvait ainsi faire état de sa richesse. Il n'est pas très difficile de comprendre, même intuitivement, pourquoi la fortune de ce chef fut de courte durée.
Aujourd'hui les plumes ont été remplacées par des morceaux de papier imprimé: dollar, euro ou autre oiseau.
Tout comme à l'époque précolombienne, le principe ne fonctionne que s'il y a rareté. Comme au temps de ce chef de tribu, la tentation est double: produire le plus de «papiers/plumes » possible et, c'est hélas une réalité, convoiter les « papiers/plumes » des autres. De nos jours, la tentation est tournée vers le dollar US, parce que les américains sont devenus les maîtres du monde.
Les USA risquent de subir le même sort que la tribu indienne parce que le dollar devient une monnaie faible et qu'ils ne semblent pas vouloir travailler pour un dollar fort, condition sine qua non pour une croissance durable. Le coût de leurs dettes risque par conséquent d'être plus élevé que par le passé et d'accélérer un peu plus la perte lente mais déjà visible de leur monopole du pouvoir qui leur a permis, dans le passé, d'emprunter à bon marché.
La banque centrale européenne, quant à elle, est parvenue à construire un euro fort. Résultat ? La croissance européenne est aujourd'hui supérieure à celle des USA.
Il n'est peut-être pas inutile de rappeler que l'Europe s'est construite depuis la deuxième guerre mondiale autour d'un deutsche mark fort.

Il serait (vraiment) dommage de vouloir faire porter par Mr. Trichet le manteau de Mr. B. Bernanke de la réserve fédérale américaine ( FED) sous prétexte que la BCE ne tiendrait pas suffisamment compte de la croissance: aucune banque centrale, pas même la FED, ne suit pleinement une politique de "nominal GDP targeting" ( croissance réelle et inflation) pour des raisons principalement techniques. Affirmer le contraire en ce qui concerne la FED relève du discours politique car, en réalité, cette dernière ne fait ni plus ni moins en matière de croissance que la BCE, à savoir regarder dans le rétroviseur, c'est-à-dire, vers le passé. Tout(e) objectif(projection) de croissance en matière de fixation des taux d'intérêt revient actuellement à prendre ses désirs pour des réalités: la crise actuelle des subprime mortgages aux USA, qui est due en partie à la forte diminution de taux décidée par la FED au lendemain du 11 septembre, en offre une parfaite illustration.
Vous dites souvent qu'il n'y a pas de fatalité. Les effets bénéfiques d'une maîtrise de l'inflation sur la croissance n'en sont pas une.

Je vous prie d'agréer, Monsieur le Président, l'expression de mon profond respect.

Wednesday, April 4, 2007

Le début de la fin de l’empire américain ?

Tous les empires ont une fin.
La fin des empires a rarement les mêmes causes. L’empire romain, par exemple, a été bâti sur les conquêtes militaires. Le début du déclin de l’empire romain remonte, selon certains, à l’introduction du port de l’étrier pour la monte à cheval.
L’empire américain a été bâti sur la puissance économique. Le déclin de l’empire américain aura une cause économique, qui pourrait être la faiblesse du dollar.

Une monnaie est le nerf de l’économie d’un pays.
Pour illustrer cela, une parure d’art précolombien exposée aux Musées royaux d’Art et d’Histoire à Bruxelles parle d’elle-même. Cette parure, qui appartenait à un chef de tribu, est un grand manteau couvert de plumes rares. A cette époque, la plume d’oiseau servait de monnaie. En couvrant son manteau de plumes, ce chef pouvait ainsi faire état de son immense fortune. Sa fortune a été, on peut le deviner, très éphémère. Aujourd’hui, la plume d’oiseau a été remplacée par des morceaux de papier imprimé. Aux USA, ce bout de papier est le dollar.

Théoriquement, on ne peut pas bâtir une économie forte sur la base d’une monnaie faible.
Pourtant, c’est ce que les USA ont fait au cours des dernières décennies, aidés en cela par des circonstances extraordinaires. Maîtres incontestés du monde « libre » jusqu’à la chute du mur de Berlin, les USA sont parvenus à imposer le dollar comme principale monnaie d’échange international et de réserve. Forts de ce statut, ils ont noyé le monde avec des dollars (en faisant tout simplement tourner leur imprimante), dollars qu'ils ont ensuite empruntés à meilleur marché sur les marchés internationaux. Exemple : un suisse ou un japonais qui a acheté des bons du Trésor américain à 30 ans en 1977, au taux de change de l’époque, recevra en 2007 des dollars qui auront entre-temps perdu plus de la moitié de leur valeur.

Cette opportunité de financement à bon marché est plus fortement exploitée par les USA depuis 1985, année pendant laquelle ils sont devenus débiteurs net sur le marché des capitaux.

Les USA ont perdu le contrôle du taux de change de leur propre devise.
La Chine a accumulé une telle quantité de dollars qu’elle est devenue quasi maître du taux de change du dollar. Elle a intérêt à ce que le dollar reste stable. De plus, l’euro est en train de grignoter des parts de marché au dollar. Les USA risquent d’être déçus s’ils espèrent continuer à bénéficier de sources de financement à bon marché. De même, les appels récents du FMI pour une dévaluation sensible du dollar risquent d'avoir peu d'écho auprès des stratèges gestionnaires chinois.

Le dollar faible, un cadeau empoisonné.
Par conséquent, la charge de la dette des USA, devenue colossale, risque de s’alourdir. La faiblesse passée du dollar, qui était vue par beaucoup d’américains comme un cadeau, pourrait laisser un arrière goût de poison. La seule antidote dont disposent les USA pour éviter une issue fatale est une réduction drastique et rapide de leurs déficits ainsi que le retour à une certaine orthodoxie économique impliquant un objectif de stabilisation du dollar. Seront-ils capables de faire tous les efforts nécessaires pour cela?

copyright © 2007 All rights reserved

Tuesday, March 6, 2007

Volatility at equilibrium points


As shown in the annexed graph, rising volatility at equilibrium points between the Dow Jones Ind. and the economy (GNP) is a healthy sign for the market. I maintain the medium/long term bullish outlook published on Feb. 14th.
copyright © 2007 . All rights reserved.


Saturday, March 3, 2007

The KMS state, the stock market and the economy

On February 15Th, I posted the following message:

"The KMS state,the stock market and the economy: a summary.
The universe is moved by 3 major interacting forces: gravity, electromagnetism and the nuclear force. The KMS state (Kubo Martin Schwinger) is a moving equilibrium between these 3 forces. The Bogdanov brothers compared the KMS state to a tightrope walker: gravity is in the pole, electromagnetism in the rope, the nuclear force in the guy holding the perch and the KMS state in the movement.
What has this to do with the economy and the stock market?
The economy is based on classical physics principles, namely thermodynamic laws, just as gravity. Finance theories, as the nuclear theory, are based on quantum physics. Derivative products, through the Black-Scholes formula, are something between the two, just like electromagnetism.
What is missing? The KMS condition.
The GDP Target Index is an algebraic based formulation attempt of a KMS-like state for the stock market.
Copyright © 2007 . All rights reserved."

I withdrew this message on March 2d because I didn't want to appear like somebody who does not have his two feet on the ground. I am restoring it after viewing the cover page of the Economist of March 3rd (picture of a foot on a rope), after I had sent a copy of my message to them ...

Here is more on this.
According to the theory of the KMS state at the Planck scale, the universe was formed from a moving equilibrium between forces at a "starting point" just after the big bang. Thus, the universe was formed from some kind of initial "non static order".

Economic and financial theories take their roots in physics. The KMS condition is a widely accepted concept in the scientific community. It is currently not being taken into consideration into existing economic/financial models which are only concerned with the visible part of the iceberg. As in physics, the invisible part of this iceberg holds in a conceptual nutshell.
A KMS-like state theory for the stock market, like the GDP Target Index, is no more speculative than the "Invisible Hand" concept of Adam Smith for the economy. The reference to the KMS state is used here as a metaphor.

copyright© 2007 . All rights reserved.

Wednesday, February 14, 2007

Dow Jones: the zero point energy

I see the Dow Jones up a minimum of 15% from where we are today.
The upward trend is fueled by what I call the "zero point energy".

The zero point is the equilibrium point between the economy ( as measured by the GDP) and the Dow Jones. Such points have been reached 8 times since the end of the second world war. We are now close to the equilibrium.
Each time the stock market has reached the equilibrium point, it moved upwards 6 times out of 8 ( with a minimum/maximum gain of 15.99%/72.73%). Thus, it moved downwards 2 times out of 8: in 1969 (when Nixon increased the capital gain tax) and on 09/11/2001.

I see no immediate threat right now.

Therefore, I can only be bullish. However, increased volatility at equilibrium points can be exploited by short term traders.

Copyright © 2007 . All rights reserved.

Friday, February 9, 2007

La bourse suit-elle l'économie?

Tout le monde peut comprendre le postulat " lorsque la bourse ne suit pas l'économie, il y a un problème". Même ceux qui n'ont jamais fait d'économie comprennent intuitivement que cette affirmation ne peut être que vraie.
En réalité, il est impossible de vérifier la validité d'une telle affirmation, sauf pour la bourse nord américaine. En effet, pour pouvoir comparer la bourse à l'économie, il faudrait pouvoir disposer, pour l'une comme pour l'autre, d'une mesure qui puisse les rendre comparables. Ce qui n'est pas le cas aujourd'hui dans tous les pays où il y a un marché boursier, sauf les USA.
Impossible? Jugez-en par vous même.
La performance économique est mesurée au travers du PIB et de la croissance de ce dernier. La performance boursière est mesurée au travers d'indices boursiers. Les indices boursiers sont calculés d'une manière telle qu'il ne peuvent être comparés directement au PIB. La seule exception est l'indice Dow Jones des USA.
Les financiers tentent de compenser ce trou dans l'information par un ratio, le P/E ( price/earnings), qui est le rapport entre le prix d'une action et les bénéfices d'une entreprise, le raisonnement étant le suivant: plus ce ratio est faible, plus une entreprise est bon marché. Est-ce suffisant?
La réponse est non. Si c'était le cas, les investisseurs auraient toujours intérêt à investir dans les sociétés ayant un faible P/E. Or, cette stratégie n'est souvent pas la meilleure.
Revenons à la question du départ, à savoir: "Comment comparer la bourse à l'économie?". Comme je l'ai signalé, l'indice Dow Jones est le seul indice qui puisse être comparé d'une manière directe au PIB. Cette comparaison amène à la conclusion suivante: au plus cet indice diverge du PIB des USA, au plus l'instabilité financière créée par les crashs boursiers est grande. Logique me direz-vous!
Comment se fait-il alors que l'on ne dispose pas d'un indice similaire dans tous les pays? C'est précisément à cette question que j'ai tenté de répondre dans le dossier "New stabilization tool for the stock market: the Profitip index (new name: LECLERE® index)".

Copyright © 2007 . All rights reserved.

Thursday, January 11, 2007

New stabilization tool for the stock market: introducing the first national GDP Target Index.

Introduction
Stock market index figures occasionally suffer extremes of volatility that are sufficient to promote economic recessions. Such bubbles occurred in Japan, at the beginning of the nineties, and in the USA in the year 2000. Both events had drastic effects on the respective economies and provided examples of how difficult it can be to correct such negative situations. At an international central banks symposium in Jackson Hole in 2002, it was made plain that all the available correction measures that were being taken were insufficient to effectively limit the size of bubbles. A quoted prime reason for stock market volatility is attributed to valuation differences: on one side the value of production assets (I) from industry; and on the other side, the stock market value of equity (K) determined by the financial world. In theory, on condition that the debt assets/debt liabilities ratio is close to one, these valuations should coincide. In reality, this rarely happens. This is due to the subjective views of each side as to future values of assets and equity.The object of the following paper is to propose a new stabilization measure aimed at drawing closer these two subjective variables using two means: a new volatility indicator and, as an option, a balancing tool.

Context
.
In economic studies, frequent reference is made to the Thermodynamic Theory. Its first law holds that: nothing is gained, nothing is lost, there is only transformation (Lavoisier). In accounting, for example, assets and liabilities must balance out. In macroeconomics, global revenue is related to global production. Pareto optimality means that, in a market economy, one cannot improve the welfare of one individual without reducing the welfare of another. This last concept is close to the concept of equilibrium in an isolated thermodynamic system.
However, a national economy is not a closed entity. It is subject to growth and recession movements.Thus, the Thermodynamics first law is applied to much major economic and financial data. But there is an important exception: growth forecasts. As a consequence, growth forecasts have to bear the consequences of the second law of Thermodynamics, which states that: any system left alone will suffer energy deterioration (entropy).
The consequence of this is that the stock market is no beauty contest, as Keynes has said, and it looks more like a jungle! This is based on the fact that investors have no other objective but to increase the value of their investments. Even though there is a common concern regarding the market liquidity, there is no true investment common purpose, which could regulate the market performance. As a result, there can be bouts of frenetic activity as well as of collective fear.

In other words, the stock market, as a valuation term and as a whole, has no emergence property.
Growth

Thus, there is a great need to estimate growth accurately. This needs to take into account a distinction between macroeconomic and microeconomic effects.
At the macroeconomic level, several theories are used to obtain growth estimates, the most common being the GDP growth of a country. Most central banks, as well as the International Monetary Fund (IMF), refer to this method. So GDP is the main parameter used in this study. Should other parameters be considered, these could be easily incorporated into these proposals.
The relationship between the (GDP) growth and the stock market performance is the object of a hypothesis made in many theoretical models. According to this, over the long term, there is no important change in the profit and dividend performance as related to the GDP of a country. In this context, the Gordon growth model (and other models derived from it) links share prices to profits, and, in turn, profits to GDP growth, since, supposedly and over the long term, market performance follows the GDP. In the US, this hypothesis is supported by historic data which show that, since 1929, the percentage of profits after taxation, compared to GDP, generally vary from 2.17 to 8.66%, with an average of 4.83% (5% if one excludes the years 1931 and 1932) (graph 1). The noted variations cover short to medium term. For long term, the percentage is 5 % on average.

Graph 1


Source : US Commerce Department
( For the period 1929 – 1946 = GNP)

The accompanying graph 2 shows that the reality is not at all that is claimed. The Dow Jones Industrial Index (DJI) variations, for example, are anything from 2 to 9% at variance to GDP figures.

Graph 2

Sources : Dow Jones Indexes / Federal Reserve Bank St Louis

In graph 2, the DJI is compared to the US GNP figures. The GNP is chosen as a proxy variable for the GDP, since GNP figures are close to GDP, and have the advantage that they are available for a longer period.
The DJI includes the 30 biggest US corporations, which represent around 24% of the nation’s total market capitalization (Dec. 2005) . The DJI has the peculiarity that it is a price-weighted index. Its sampling is statistically valid, even though it does omit the small/medium capitalizations. Other major indexes offer a bigger range of sampling, but they are market capitalization indexes, which means that they take into consideration not only the price but also the shares trading volume. These indexes are more difficult to associate with GDP, which does not include the volume aspect of the production of a country. It is important to note here that the recommendations within this study do include a much wider range of companies than the DJI does.

The following should be borne in mind:
1) The GDP and the DJI have the same ratio scale, which facilitates comparisons.
2) Over time, the GDP is less volatile than the DJI.
3) During the period 1900 – 1920, the much-overvalued US stock market had to patiently await the picking up of the economy.
4) Since the Second World War, the stock market has under-performed the true picture of economic activity during the periods 1941 – 1954, 1969 – 1998 and from 2002 until now, i.e. 70% of the time.
5) The stock market peaking during the nineties was caused by the need for catching up with the improved economic situation.

According to Ellen McGrattan and Edward Prescott (Taxes, Regulations, and Asset Prices. Working Paper, 610. Federal Reserve Bank of Minneapolis), this was mainly due to a more favorable tax environment. They also argued that the stock market was not overvalued in 2000, a claim which is supported by graph 2.

Since the beginning of the 20th century, 15 crashes have been recorded. Three of them (1929, 1969, 2000) were qualified as being speculative (" irrational exuberance") because of the high price/earnings ratio observed then. According to F. Mishkin and E. White ( "What Should the Fed Do About Stock Market Crashes: A Historical Perspective"), bubbles are not always accompanied by financial instability (examples: 1903, 1940, 1946, 1962 and 2000). According to them, other crashes were either:
- highly stressing (1907, 1930/33, 1937, 1973/74);
- stressing (1987, 1929);
- moderately stressing (1917, 1920, 1969/70, 1990).
.
Graph 3
(click on graph for a better view)
"Divergence DJI GNP" is the ratio: (GNP-DJI)/GNP.

One can observe in Graph 3 that "not stressing" crashes (s) tend to cluster around the equilibrium point (0.00%). Out of 15 crashes, the 1903 crash is the only exception to this rule. On the other hand, worse crashes (xl and l) in terms of financial instability, tend to occur at more remote points from the equilibrium.

Graph 2 illustrates the differences between both types of evaluation: the first, which links the value of productive assets to the GDP evolution, and the second, which links the value of equity to the stock market performance. These two approaches need to be reconciled so that the graph curves correspond more and the market index follows more closely the GDP pattern.

What may be rather straightforward from a macroeconomic point of view is by no means as easy at the microeconomic scale. The stock market represents a bundle of transactions affected by corporations undergoing circumstances sometimes very different one from the other. In some instances, there may even be quoted companies that are unaffected by prevailing general economic conditions. Additionally, there are often cases where short-term volatility does not preclude medium or long-term stability.

Most financial models view investors as pollen particles ( Brownian motion) having rational expectations (Efficient Market hypothesis ). While Economic theory is based on "Newtonian" principles, Finance theory is based on Chaos theory. However, financial models did not prevent the numerous crashes which took place since they were first introduced by Bachelier in 1900, despite many improvements which have been made to them since then (derivative products). The reason is that the reference used to calculate volatility is not appropriate, making difficult the distinction between reasonable and excessive volatility. Therefore, when planet Finance moves too far away from its orbit around planet Economy, there can be financial instability.

Hence, we arrive at the question - how do we reconcile the two approaches: macroeconomic and microeconomic?

Our objective is to find an emergence property for the stock market while preserving the stochastic process of its constituents. How? By introducing a measure of volatility of the stock market vis-à-vis the nominal GDP growth as well as an optional balancing tool: a late entry/exit fee.

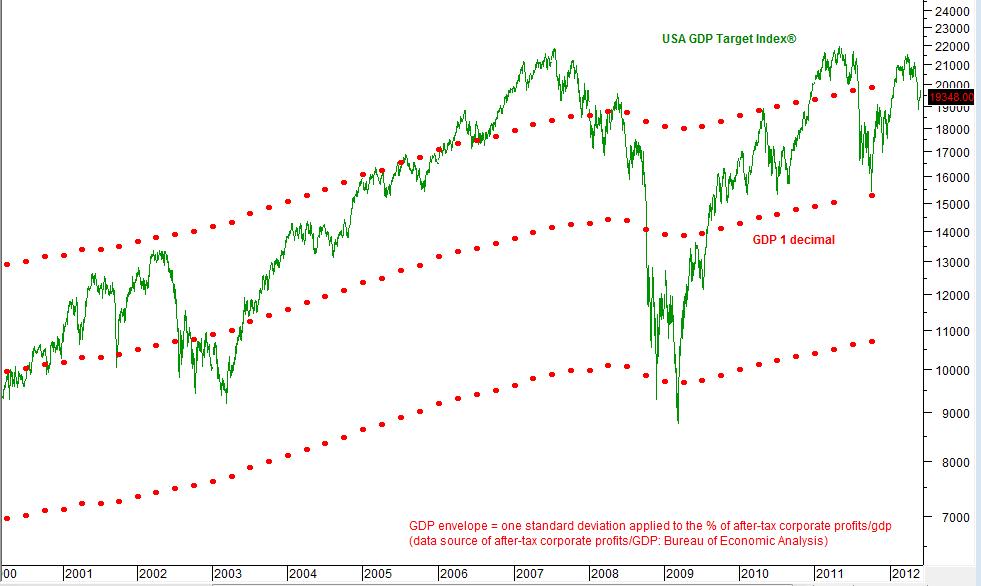
The volatility indicator is an envelope of four components: the GDP Target Index, a reference index and two deviation coefficients.

In contrast to existing indexes, the GDP Target Index is a GDP weighted index, which utilizes the turnover of domestic corporations as its sole weighting factor. The index would serve as a benchmark for an equilibrium state of the stock market.

Continuing with the US as an example, the percentage of profit after taxation varies as a ratio of GDP from 2 to 9%, with an average of 5% (not considering exceptional or extreme situations as in 1931/32). The GDP Target Index would have to oscillate between 2/5 and 9/5 of the GDP variation for the stock market to be in equilibrium.

(The range of variation would need to be adapted for each country, in order to match the relevant profit levels).

Illustration:


(click on graph for a better view).
The curve ‘Average index’ (5%) is the reference index using 100% (5/5) of the GDP variation. Example: if the GDP grows 3%, the Average index (5%) also grows 3%. The curves “Index 2/5” and “Index 9/5” respectively represent the minimum (2%) and maximum (9%) of deviation authorized around the Average index (5%).
An example: If the GDP grows 4%, the stock market would be in equilibrium when the GDP Target Index grows between 1.6% (2/5 x 4%) and 7.2% (9/5 x 4%).

Advantages of the GDP Target Index:
1) Weighted according to the single factor “revenue” of domestic companies, it can be compared directly with the GDP.
2) On the one hand, no reference is made to the profits made by any one company. On the other hand, the greatest number of listed domestic companies is included. Hence, any biases (such as value/growth and small/large caps), usually found in traditional indexes, are avoided.
.
Optional balancing tool: late entry/exit fee
.
As an option, a late entry/exit fee could be applied, allowing late comers to enter the market at a price reflecting a degree of urgency. The fee could be equal to the average dividend yield rate, for example, and charged to buyers when the market moves above the top of the envelope and to sellers when it moves below the bottom.
Addendum 13th June 2011: this idea was suggested within the context of "all other conditions being me", like the fiscal policy to name but one. In practice, this constraint makes the "optional balancing tool" a ... useless, if not a dangerous, tool ... It is believed that the mere information provided by the index could, if made public, act as a stabilization tool on its own.

Preliminary condition ( if the late entry/exit fee is applied).

The index can help maintain the equilibrium between (I) and (K), ceteris paribus. If the late entry/exit fee is applied, authorities would need to take all appropriate measures, fiscal and others, for the equilibrium to be reached before and maintained after the implementation.
Should this condition not be met, there is a risk of a liquidity crisis.
.
Opportunity for industrialized and emerging countries
.
In a 2005 speech, B. Bernanke (April 14, 2005. Remarks At the Homer Jones Lecture, St. Louis, Missouri) spoke of the opportunity provided by the high growth rates in emerging countries for pension funds in industrialized countries. The higher volatility of emerging markets hinders such a development. By enhancing market stability, particularly in emerging countries, the present project could improve returns of pension funds which have to support aging populations.
.
Accounting difficulty
.
Our proposal assumes a timely and accurate collect of GDP data. Progress in this respect has to be made in many countries. (Delays in obtaining definite data are often quoted as a prime difficulty for the implementation of a nominal GDP targeting policy).
The generalization of technological means makes us believe that the information required could be made available in a not too distant future. Until then, and when necessary, a set of proxy data could be used for an early application.
.
How does this proposed solution allow solution of the equation I = K?

Under the premises:
- Interest rates are a function of growth (Taylor rule);
- Economic growth can be measured by the GDP growth (c.f. the IMF);
- According to the neo-classic theory, which invokes the von Neumann Golden Rule, the rate of interest balancing the offer and demand of loans is the same as the rate equilibrating Investment (I) and Savings (which are the source of K) .

In consequence, strengthening the bindings between capital (K) and the GDP can but increase the relationship between (I) and (K) .

Furthermore, a closer link between (I) and (K) would create a closer association between average dividend yield and average equity risk premium.

Conclusion

In the macroeconomic context of a debt assets/debt liabilities ratio close to one, this study describes a method with the aim of maintaining the balance between the two values: value of production assets (I) and stock market value of equity (K). This is achieved by the use of a new volatility measure comprising a new index, a GDP Target Index, based on the evolution of the turnover of domestic companies. In cases where the debt assets/debt liability ratio is substantial, the index would require an adaptation, which is the object of a separate study.

(previous name of the index: Profitip index)
Copyright © 2011 . All rights reserved.

First edition in April 2006.